|
|
| Re: background colour in structure editor [message #623 is a reply to message #621] |
Fri, 06 September 2019 19:13  |
 nbehrnd
Messages: 208
Registered: June 2019
|
Senior Member |
|
|
Dear Avril,
the easiest solution were to go to the entry "help" in the GUI, where
you find "Look and Feel", with multiple options to choose from. This
equally is illustrated on the manual pages,
http://www.openmolecules.org/help/installation.html#Installa tion
The «graphite» theme inverts parts of the color scheme seen for example
with the «classic» theme. If you need to invert a screen photo, or a
diagram plot by DW this way at a later point of time, you may resort to
imagemagick with an instruction in pattern of
convert in.png -negate -modulate 100,100,0 out.png
To demonstrate the effect, here is a plot with DW's `boxplots.dwar` built-in
test data:
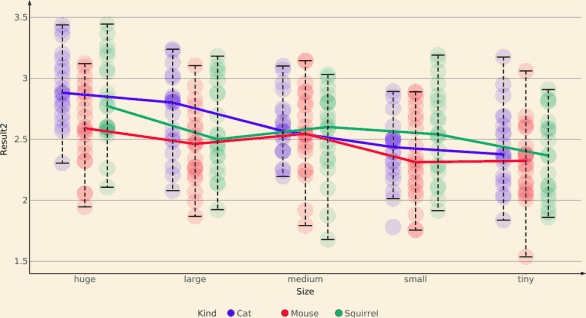
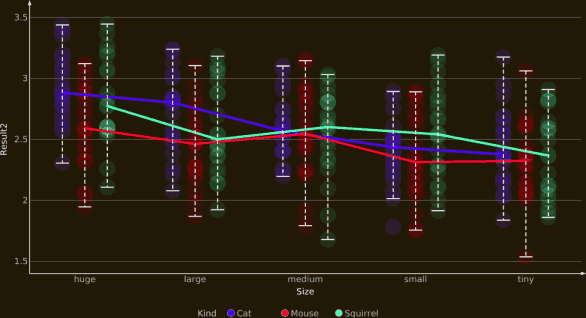
and here the same plot, after exporting as `.png` and partial color inversion:
You find the program at https://imagemagick.org/. The credit to this form of
image manipulation belongs to Jimmy Kromann, posted on twitter, in July 2018,
https://twitter.com/jckromann/status/1019563241465315328.
Norwid
[Updated on: Sat, 07 September 2019 19:14] Report message to a moderator |
|
|
|

 Search
 Help
Help Members
 Register
 Login
Login Home
Home


")
